Mobile Location Data Analysis
To support a variety of projects across the country assessing the impact of COVID on small businesses, I’ve looked to the data vendor SafeGraph.
SafeGraph’s core product is a comprehensive dataset of "locations where consumers can spend money and/or time” which they enrich with anonymized mobile location data using a proprietary attribution model to estimate visitation trends for these places.
Purely a raw data vendor, SafeGraph leaves it up to you to make the data actionable. Using this data I’ve developed custom Python modules to conduct a variety of analyses such as:
Using these analyses, HR&A is able to produce tailored assessments of the current state of local small businesses and develop specific recovery strategies targeting the areas of most need.
To support a variety of projects across the country assessing the impact of COVID on small businesses, I’ve looked to the data vendor SafeGraph.
SafeGraph’s core product is a comprehensive dataset of "locations where consumers can spend money and/or time” which they enrich with anonymized mobile location data using a proprietary attribution model to estimate visitation trends for these places.
Purely a raw data vendor, SafeGraph leaves it up to you to make the data actionable. Using this data I’ve developed custom Python modules to conduct a variety of analyses such as:
- understanding the catchment area of whole retail corridors, extrapolated to understand what share of visitors are local, regional, or out-of-market tourists.
- charting the visitation trends of specific categories of retail to understand which sectors are driving recovery.
- assessing the impact of interventions such as open streets on the performance of small businesses.
Using these analyses, HR&A is able to produce tailored assessments of the current state of local small businesses and develop specific recovery strategies targeting the areas of most need.
June 2020 - Present
![]()
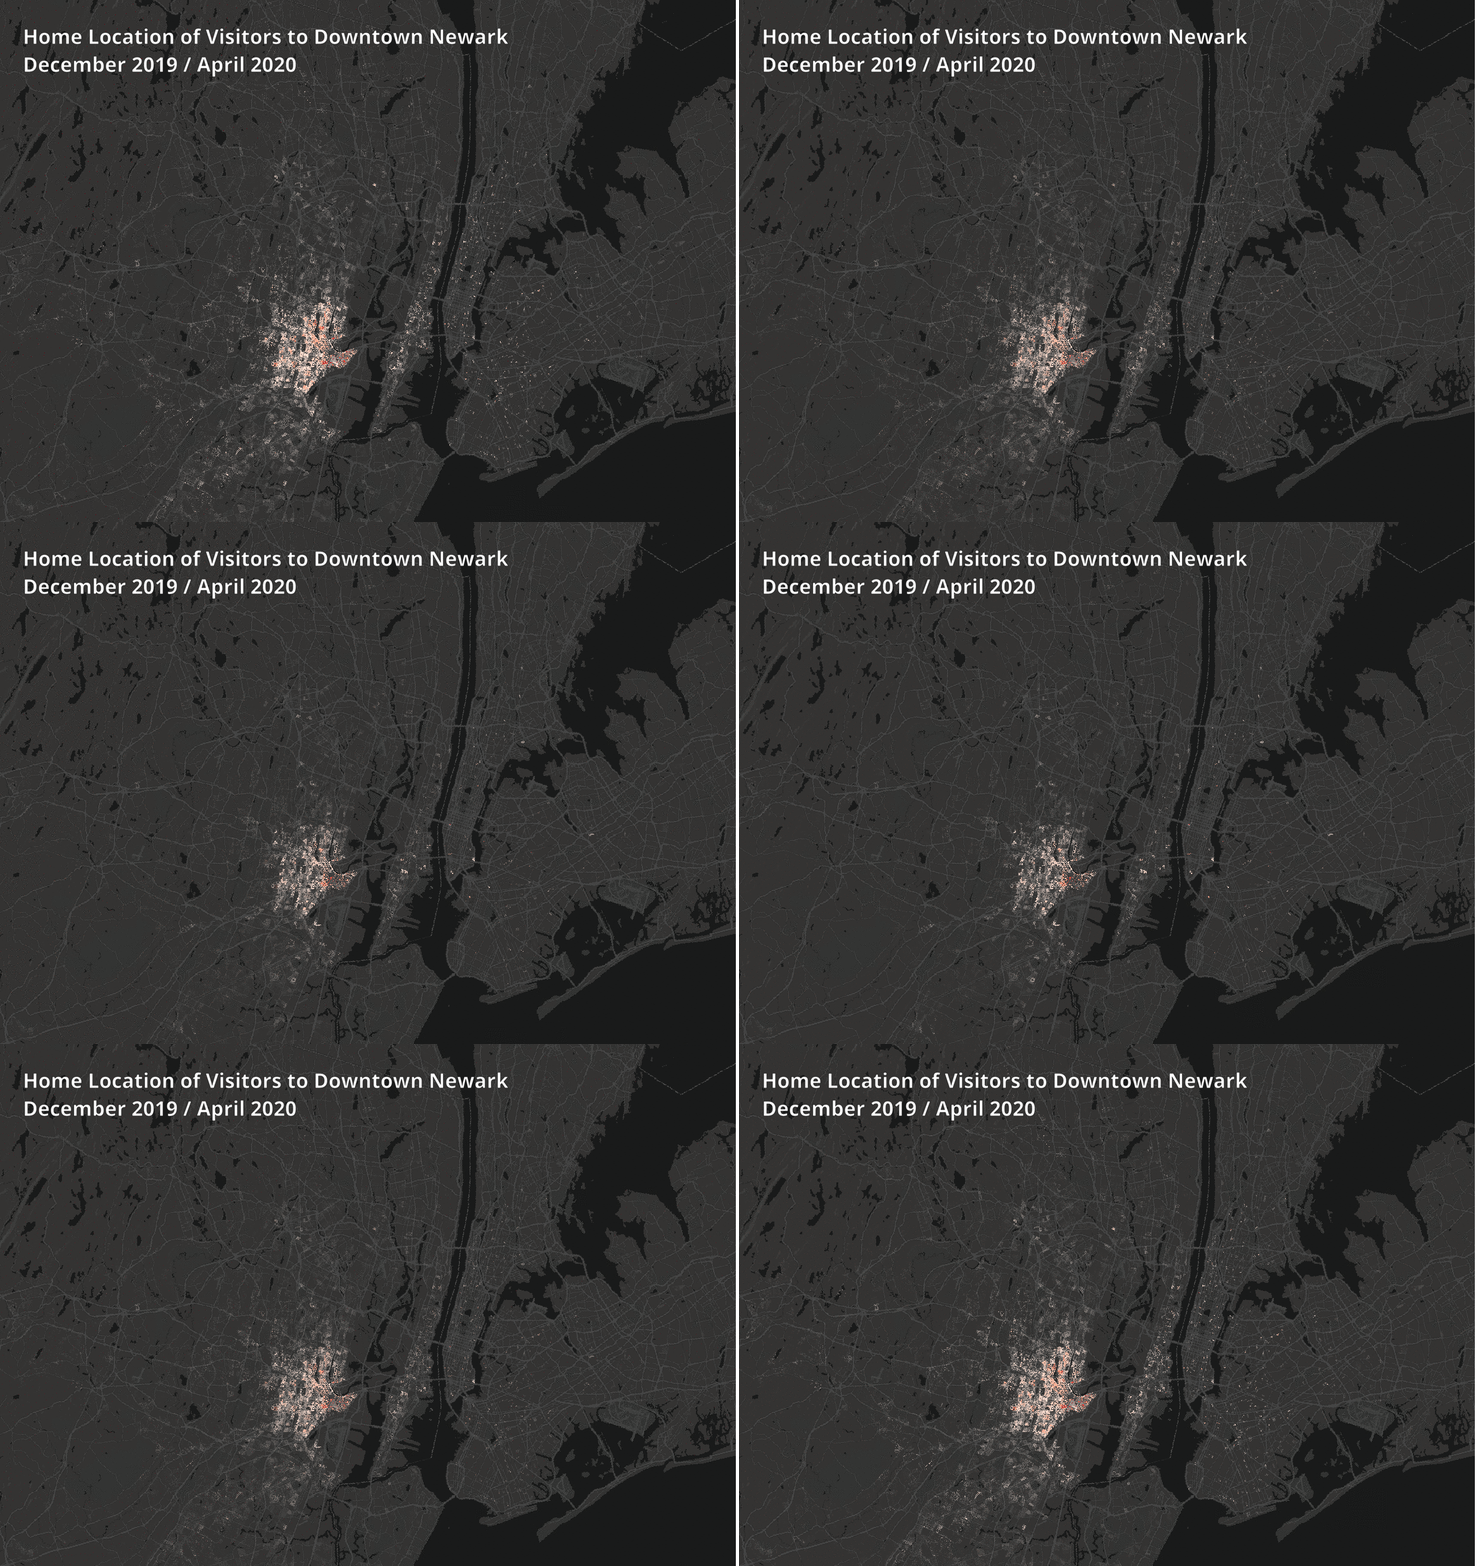
Mapping the change in visitor-shed to Downtown Newark post-COVID. In many downtowns, closing – and then reopening – food and beverage establishments has had the greatest impact on foot traffic.

Mapping the change in visitor-shed to Downtown Newark post-COVID. In many downtowns, closing – and then reopening – food and beverage establishments has had the greatest impact on foot traffic.