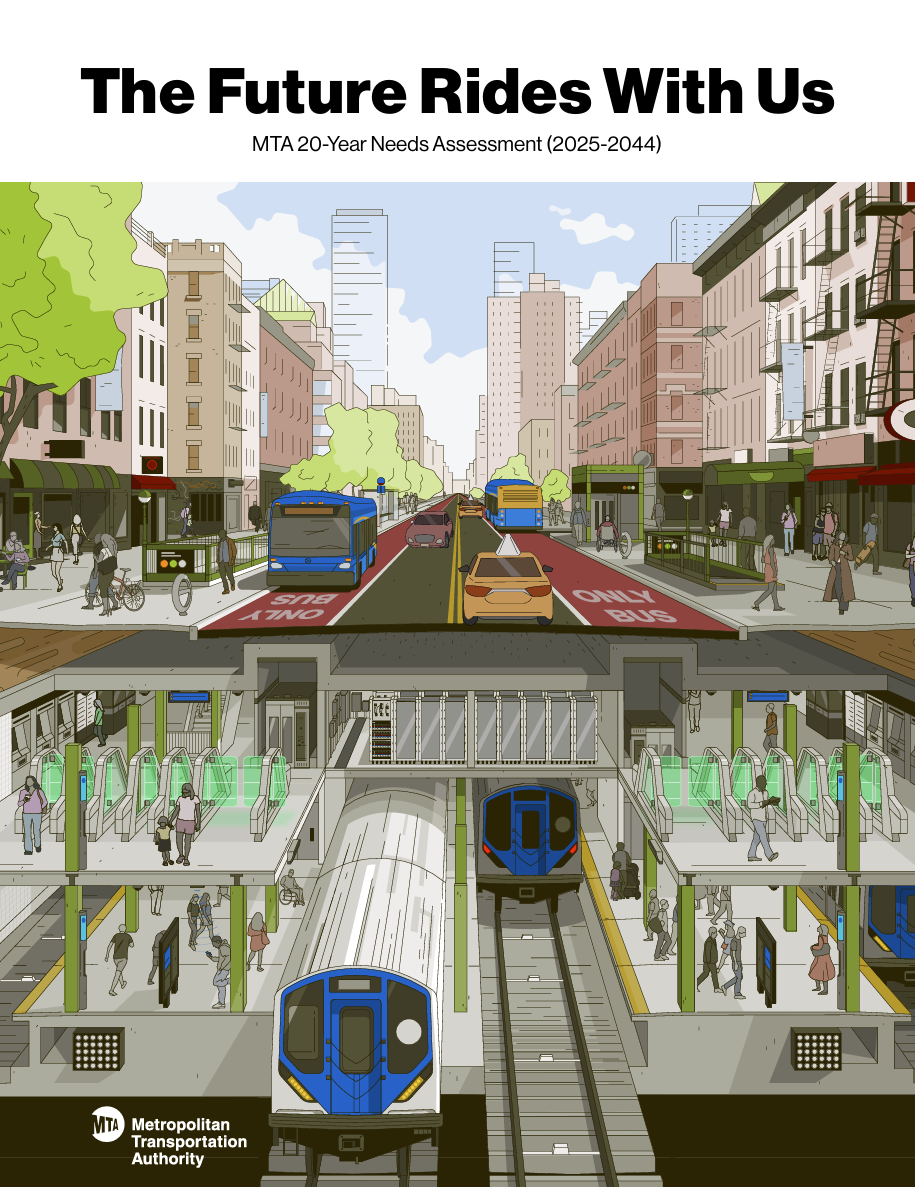
MTA 20-Year Needs Assessment October 2023
After starting at the MTA in Winter 2022, my first project was working on developing their 20-Year Needs Assessment – an ambitious, broad, and comprehensive blueprint that outlines the MTA region's transportation investment needs for the next 20 years.
When we first started envisioning what we wanted this report to look like, we knew it needed to be more data-driven, more transparent, and more engaging and accessible to the folks who have most at stake: our riders.
This document takes a hard look at the state of the system, underscoring the urgent need for renewing and upgrading our existing infrastructure. It also advocates for picking up the pace in modernizing the system for the 21st century, with an aim to foster a more accessible, resilient, and sustainable transit network.
For the first time, rather than limiting ourselves to only discussing the projects we think will get funded, we did a detailed and honest accounting – a gargantuan task analyzing the state of millions of assets worth over $1.5 trillion dollars and laying them all out for the public to see the full scale of our needs.
Our journey in crafting this report was a dive into uncharted waters. The way we approached data and the colorful and engaging narrative we built around hard facts significantly contrasts with past publications. We've not only analyzed complex topics but translated them into a language that hopefully resonates with everyone, making the report a more visual, accessible, and engaging tool to empower the public to advocate for a better transit future.
And if you know me, you know I needed to make it an interactive website, too.
future.mta.info
HR&A Public Reports 2019-2022
From 2019-2022, I worked at HR&A Advisors - a consulting firm that specializes in providing strategic advice on real estate, economic development, and urban planning issues to public and private-sector clients. I worked alongside a talented team of experts to help a range of clients make informed decisions about how to grow and develop urban areas sustainably and effectively.
Over the course of my tenure at HR&A, I specialized in developing advanced methodologies to analyze market trends, economic conditions, and community needs to provide clients with recommendations on how to create vibrant, livable, and economically thriving communities. I worked across a broad cross-section of projects including the development of funding and governance plans for new parks, leading economic impact analyses, designing affordable housing strategies, or developing policies to help attract businesses and jobs.
Here’s a select sample of publicly available work that I contributed to during my time at HR&A:
- The Effects of Upzoning Single Family Neighborhoods on Supply and Affordability - California Community Builders
- Joe Louis Greenway Framework Plan - City of Detroit
- Greater Corktown Neighborhood Planning Framework - City of Detroit
- Park Avenue Centerline Planning Framework - Grand Central Partnership
- Affordable Housing Broadband Initiative - New York State Association for Affordable Housing
- Economic Impact of East Hampton Airport - Town of East Hampton
- Long Island COVID Economic Impact Study - Nassau and Suffolk County Industrial Development Authorities
- Rochester, MN COVID Impact Study - Destination Medical Center
- Newark Equitable Economic Recovery Plan - The City of Newark
Wordles With Friends
Like most people, my family has gotten really into Wordle. We have a group chat where we share scores everyday and complain about particularly hard words. We had a good sense of who was doing better than others, but I wanted to make it a bit more competitive...
Wordles With Friends is a text-bot that automatically tracks all Wordle scores in any group text-chain based on the standard Wordle "Share" format. Once all members of the group chat have shared their scores for the day, the bot tabulates rolling scores and shares the current leaderboard.The bot awards points based on the number of guesses.
Link
March 2022
![]()
Include +1-507-WORDLES (+1-507-967-3537) in any group-text to start an automatic score tracker. (Or use it to track your own scores across devices)

Include +1-507-WORDLES (+1-507-967-3537) in any group-text to start an automatic score tracker. (Or use it to track your own scores across devices)
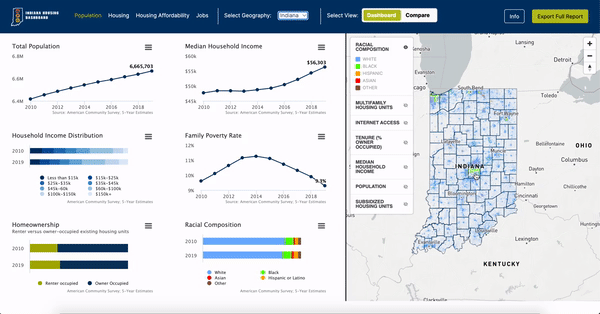
IHCDA Indiana Housing Dashboard
On behalf of the Indiana Housing and Community Development Authority, I developed an interactive web-based dashboard to showcase metrics measuring relevant demographic and housing related trends for the whole state and across all counties.
Combined, these metrics form the baseline of a housing needs assessment meant to inform the public of the state of housing production and affordability where they live in order to highlight inequities and help to better promote racially equitable outcomes through the allocation of housing resources across the state.
Link
December 2021
![]()
An interactive dashboard featuring map and data visualizations of demographics and housing trends in the State of Indiana.
An interactive dashboard featuring map and data visualizations of demographics and housing trends in the State of Indiana.
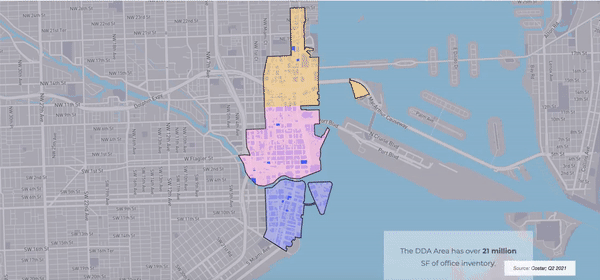
Miami DDA Interactive Office Market Report
Working on behalf of the Miami Downtown Development Authority I helped drive a shift away from a prior focus on PDF market reports to a new web-based format featuring an interactive scrolling narrative that combines the timeliness and dynamism of live dashboards with the nuance and critical lens of a research brief.
This modular structure contains a series of interactive graphics and charts that ingest and transform live data from a variety of sources and displays the outputs instantaneously accompanied by a static narrative that provides color to recent development trends and draws attention to the dynamism and potential of Downtown Miami.
Link
March 2021
![]()
A scrolling data visualization of the future of Miami’s downtown.
A scrolling data visualization of the future of Miami’s downtown.